New in gINT 8.2
gINT SoftwaregINT is the leader in software for Geotechnical and Geoenvironmental data management and reporting with over 7,700 licensees in 68 countries. Datgel is an authorised global reseller of gINT. As of 2026, gINT can only be sold to accounts/companies that hold existing licenses.
| ||
From point solutions to systems customized to your requirements, leverage Datgel's advanced knowledge and experience with gINT:
|
|
gINT Version 8.2 - New Features
There are many new features in gINT version 8.2, here are some of our favourites:
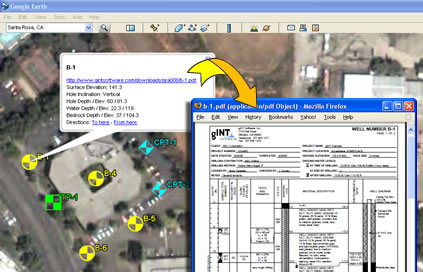
View Boreholes within Google EarthTM
With gINT 8.2, you can now display your investigation location icons within Google Earth. In Google Earth, you can:
- Define the colour, style and label of the icon.
- Add a description to the icon.
- Link the icon to a PDF file of the investigation location log so that the PDF file is launched when you select the icon.
- Customise the displays using the gINT Rules features
View a PDF or View a Demo or Download an Example File (Google Earth required)
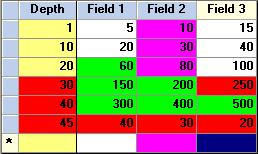
Highlight Data With Different Colours
Individual cells, columns and rows can now be coloured automatically by your criteria. For example; if you have a table containing information about a soil type of particular interest, you could set the rows containing that soil type to show as green, whereas soil types that were of less interest could be set to show as red.
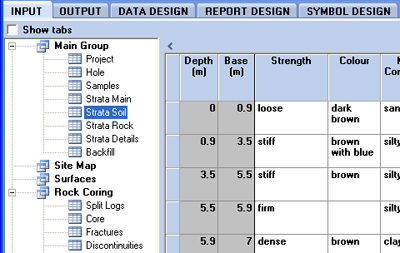
Show the Input Application Group as a Tree Format
There is now an option for you to view the Input tables as a Tree Format, as the default Tab Style or as both.
Surfaces Defined by TIN's (Triangulated Irregular Networks)
Similar to grid surfaces, on a 2 dimensional fence diagram, it is now possible to display profile lines from a TIN surface.
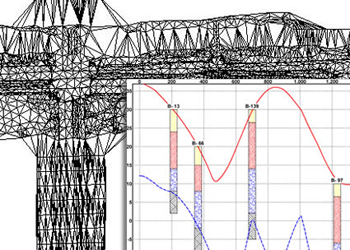
Set Graph Scales for Each Page
You can now control the graph scale on each report page by using the data or by your own criteria.
Set Baselines from a Road Alignment
The new Alignments Tab allows you to store baselines and road alignments within the project database. The road alignments can then be shown on the site map and on fence diagrams as selectable baselines.
LandXML Import
- Import TIN Surfaces, Alignments and Site Map drawings from LandXML.
- LandXML is a land development / civil engineering / survey electronic interchange format supported by major Civil Design Software packages such as AutoCAD Civil 3D, Bently MX and InRoads.
Control The Region Displayed in a Fence Report Site Map
In the past if the baseline had a significant curve, it was difficult to display the correct site map region below the corresponding Fence area on a gINT Fence report. Now, the region displayed is user definable...define the East and North of the bottom left corner of the region, along with the display orientation angle.
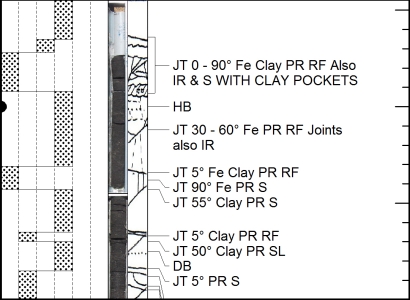
Depth Related Images on Logs
The new depth related bitmap image feature allows you to display images matching the report log vertical scale on your reports. For example, on a borehole log, drillcore photos can be scaled to show on the log in a column relative to the depth. The images can also be broken across a page.
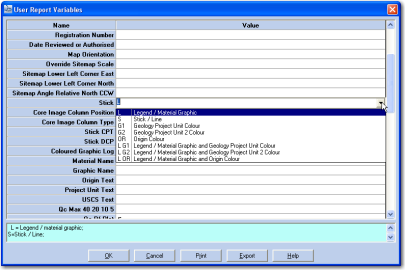
Field Properties for User Report Variables
User report variables are now designed like project file fields, with data types and lookups.
Generate Soil Descriptions and Classifications in Input
Using gINT Rules soil classifications and descriptions, based on PSD and Atterberg lab data, can be written to project file fields.
gINT in Additional Languages
In addition to English (US), support is now offered in the following languages:
- Czech
- English (UK)
- Spanish
View a complete gINT version 8.2 feature list.