gINT Logs
gINT SoftwaregINT is the leader in software for Geotechnical and Geoenvironmental data management and reporting with over 7,700 licensees in 68 countries. Datgel is an authorised global reseller of gINT. As of 2026, gINT can only be sold to accounts/companies that hold existing licenses.
| ||
From point solutions to systems customized to your requirements, leverage Datgel's advanced knowledge and experience with gINT:
|
|
gINT Logs
Let gINT do the hard work for you with borehole logging software.
gINT automates repetitive tasks giving you the greatest speed, power and flexibility in borehole log software.
High-quality software at a low-cost.
Save time, option to use standard or customised logs
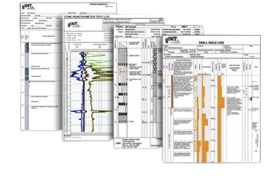 Select one of the standard log reports or download one from our website. Alternatively you can create your own customisable log reports or have us create one for you.
Complete flexibility. Countless time saving tasks, calculations, routines and options saving you time and effort.
gINT Logs also offers a variety of data input tools to help streamline data entry. For example, you can create lookup tables that standardise and speed up data entry. Because your customisable choices appear in a drop-down list, this means fewer keystrokes. You can also create your own required fields, default values and descriptions, which facilitate fast and accurate data entry.
Required fields and default values help ensure data integrity, while descriptions help the person entering the data learn the requirements of particular fields. An extensive library of nearly 1,000 symbols gives you added flexibility in designing your logs. You can add to the symbol list with your own custom symbols as well.
Your logs can include virtually any type of subsurface data including environmental, geophysical, petroleum, mining and more.
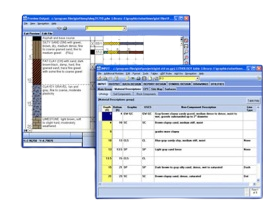 Enter or Import your data
Easily import from excel and many other programs.
Cut and paste in gINT's spreadsheet-style grid or use the graphic-input mode to see your log image change dynamically while you enter data, making data entry a breeze for users who prefer working with data input in a graphical format.
You can add company logo's additional graphics, bar charts, plots, photos, site maps and other information to your logs.
Easily Upgradeable
Because the program is easily upgradable to gINT Professional, it is a solid foundation for geotechnical data management and reporting that will continue to work to meet your company's needs over many years.
Create the report the way you want it
Print or export your logs to a wide variety of formats: DXF, BMP, JPG and more. gINT even lets you print to PDF without using Adobe Acrobat. The following file types are supported:
- PDF (Export)
- Excel (Import & Export)
- DXF (Import & Export)
- RockWorks (Export)
- LogPlot (Import)
- WinLog (import)
- Database files
- Raster images (Import & Export)
- HPGL 1 (Import only)
You can also publish boreholes to Google Earth, or access your gINT boreholes from ArcGIS.
Time Saving and Flexible Options
gINT Logs also offers a variety of data input tools to help streamline data entry. For example, you can create lookup tables that standardise and speed up data entry. Because your customisable choices appear in a drop-down list, this means fewer keystrokes. You can also create your own required fields, default values and descriptions, which facilitate fast and accurate data entry.
Required fields and default values help ensure data integrity, while descriptions help the person entering the data learn the requirements of particular fields. An extensive library of nearly 1,000 symbols gives you added flexibility in designing your logs. You can add to the symbol list with your own custom symbols as well.
Using gINT Professional, you can report your data in many other ways including cross sections/profiles, tables, graphs, lab reports and more.