DGD Tool - Material Mass Classification
DGD Tool
The complete gINT system for geotechnical in situ and lab result storage and reporting, including logs for boreholes, test pits, DCPs and vibrocores, and a large range of summary graphs, histograms, fence, table, and map reports. The best gINT can be, without you spending years developing it for yourself.
DGD Tool is the Leading Borehole Logging Software Add-In for gINT
DGD Tool - Material Mass Classification
The Datgel DGD Tool allows you to rapidly classify zones of material in your investigation data.
Based on a user defined system you can streamline the classification of materials and the interpretation is written to a database table. The classification can be displayed on reports and used for 3D modelling.
The classification system is divided into two sections. The first allows the user to define the name of their classification and specify up to three tables (the parameters) from their database that they want to use for their classification. The second section allows the user to define a range (the zones) for each parameter that will determine the classification of the material.
For example, you may wish to estimate the degree of difficulty that could be encountered when excavating a sandstone. As could be expected, there would be a range in the degree of excavatability of the material based on its nature. To assess this you may decide that the three parameters you need to use are; the geology, the rock strength and the degree of fracture spacing. An example of a zone for these parameters might be:
| Zone Name | Geology | Rock Strength | Fracture Spacing |
| Easy Excavation | Sandstone | Extremely Low to Low Strength | 0 mm to 30 mm |
Using this example, a sandstone that has a strength between Extremely Low to Low and that has a fracture spacing between 0 mm and 30 mm would be interpreted as Easy Excavation. You would then replicate the above to define each zone for differing degrees of excavatability, as below:
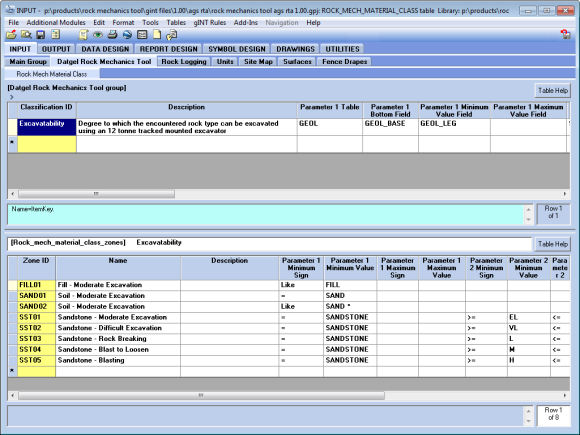
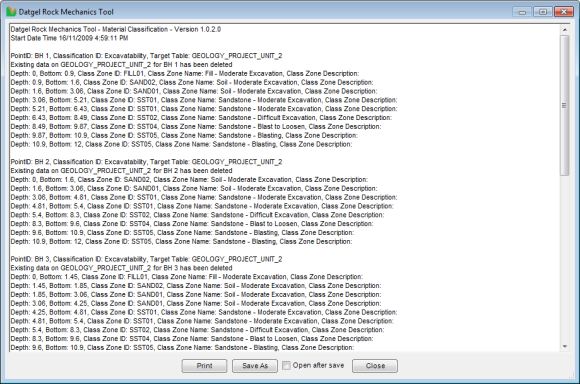
Once a classification system has been defined, you can select it on the Point Table for each investigation hole that you want to use it for. When the tool is run, the top and bottom depths for each classification zone are written to a table in your database (as defined by the user) and a report is provided (like the one below) to inform you of what changes were made and what information was written to your project database.
The DGD Tool are also supplied with a Fence Report that allows you to visualise the zones on a cross section. The colours for each of the material classification units can be defined by the user to assist in the visualisation of the classification.
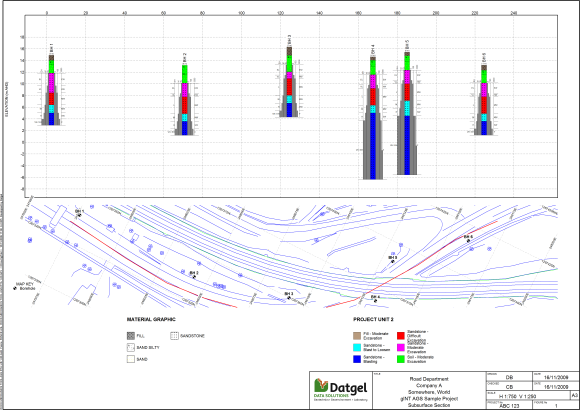
Example Fence report