DGD Tool Summary Graphs, Histogram and Table Reports
DGD Tool
The complete gINT system for geotechnical in situ and lab result storage and reporting, including logs for boreholes, test pits, DCPs and vibrocores, and a large range of summary graphs, histograms, fence, table, and map reports. The best gINT can be, without you spending years developing it for yourself.
DGD Tool is the Leading Borehole Logging Software Add-In for gINT
DGD Tool - Summary Graphs, Histograms, Tables and Text Documents
Over 200 of these reports are included.
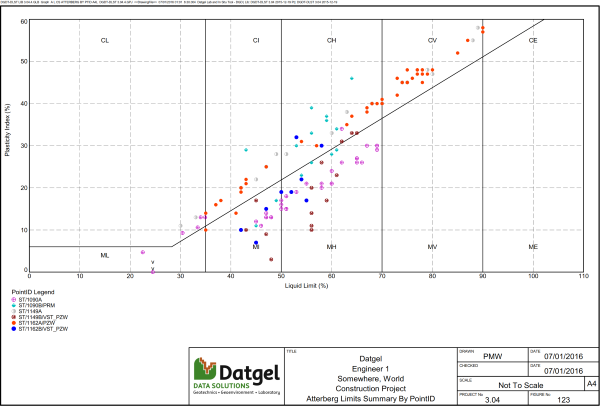 Example Liquid Limit vs. Plastic Limit graph | |
 Example PSD graph | 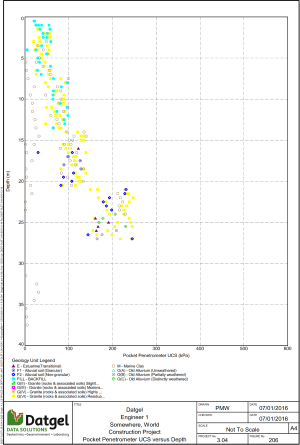 Example Pocket Penetrometer UCS vs. Depth Graph |
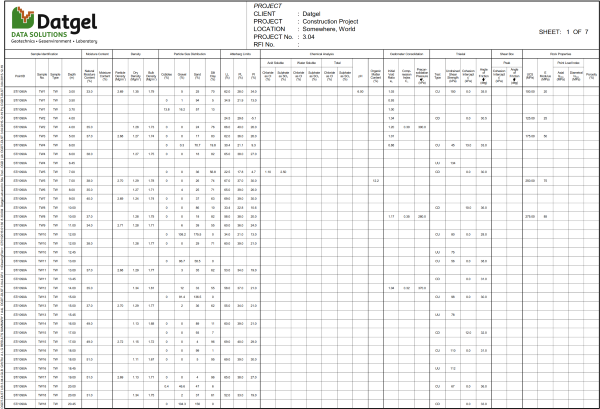 Example Laboratory results Table | |
 Example SPT N value histogram | |
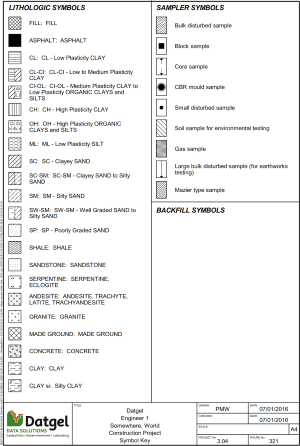 Example Key To Symbol | |
If you are an existing member, Log in here to access brochure