


-

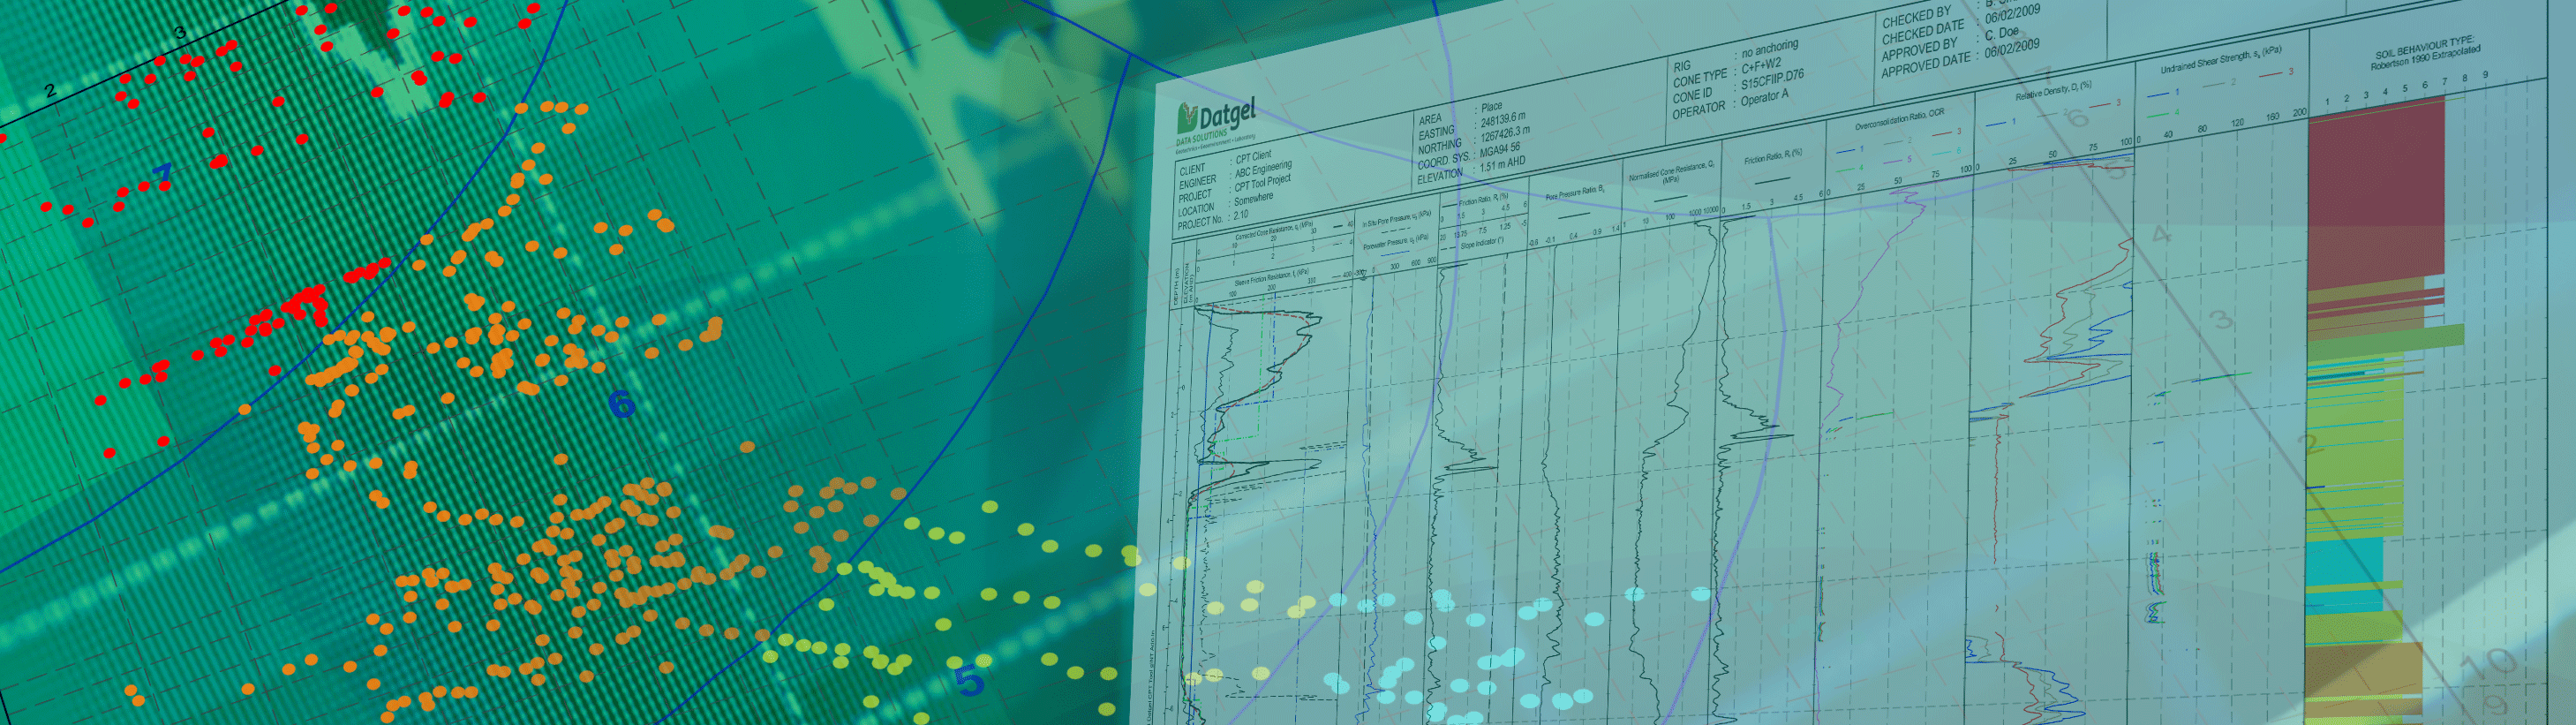
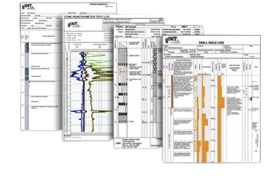
CPT Tool
Import CPT data from 18 file formats, calculate derived parameters, SBT, >100 correlations, liquefaction, shallow and deep foundations, user definable formulas. Produce CPT log, graph and section reports.Learn more -

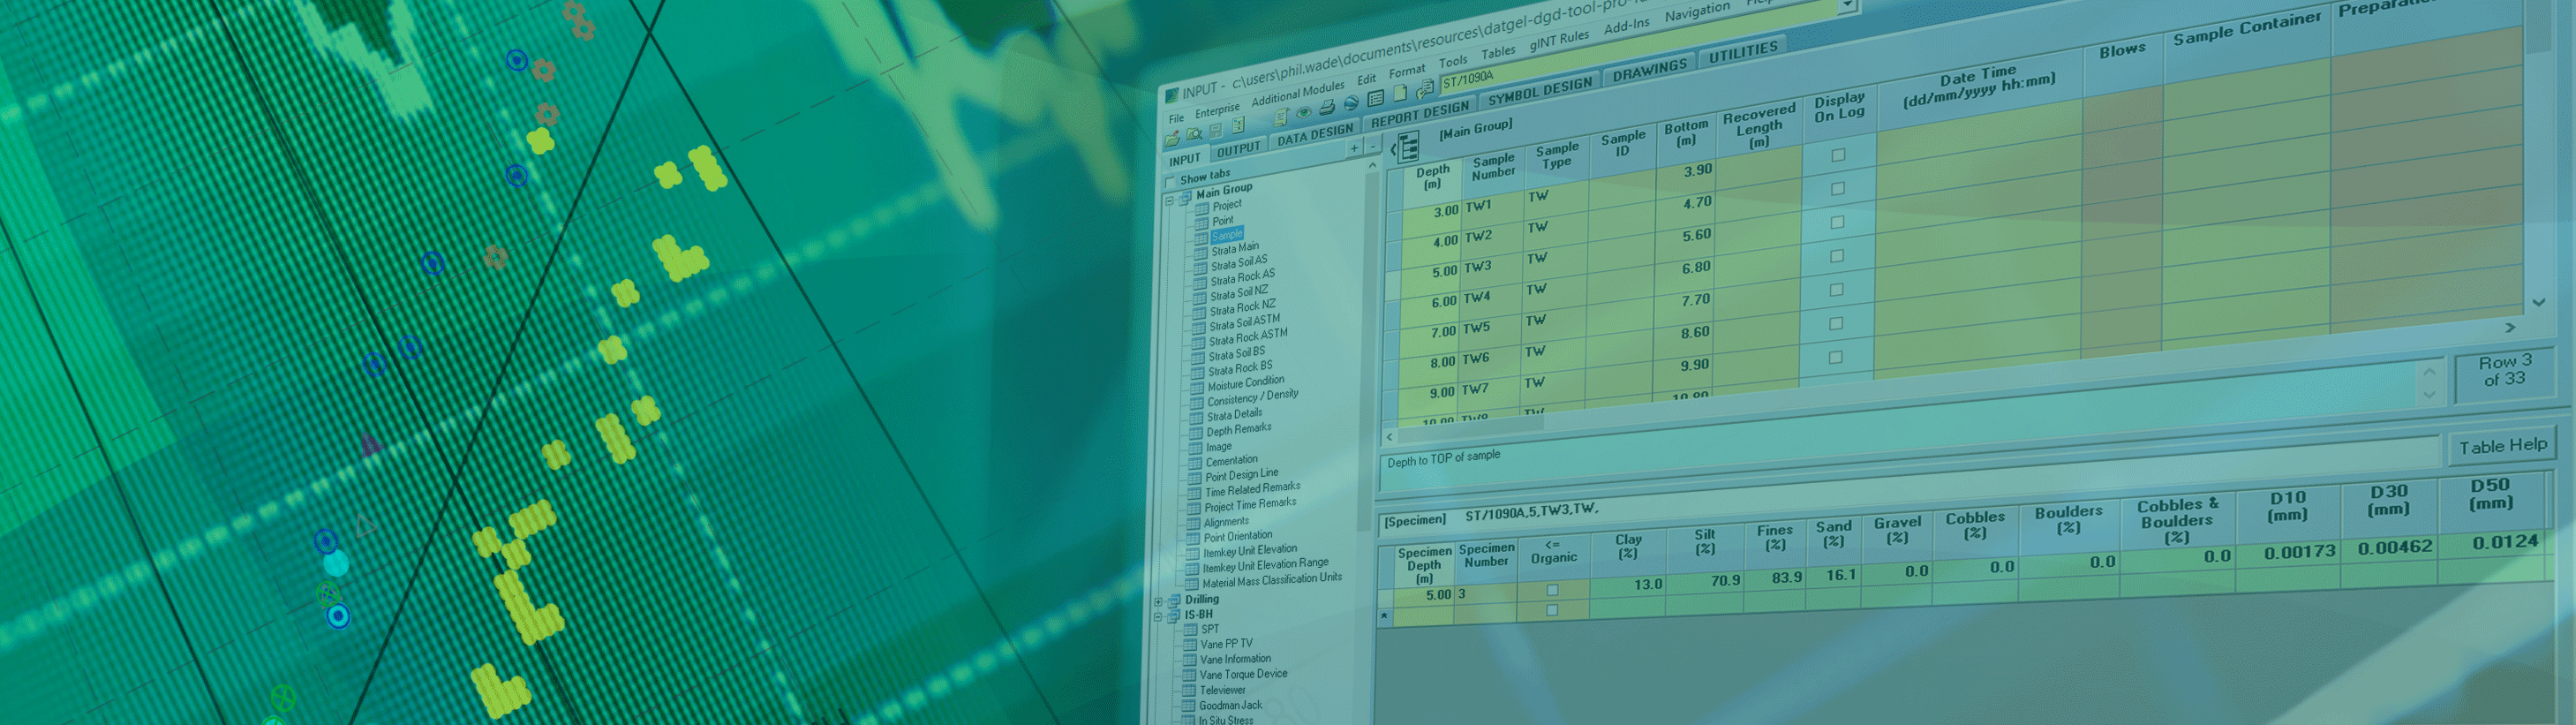
DGD Tool
Geotechnical in situ and lab result storage and reporting with AS, ASTM, BSI and NZGS logging standards. Professional edition supports AGS Format and has >300 reports.Learn more -

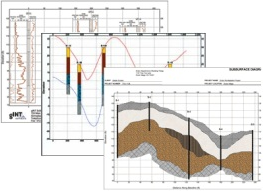
Fence and Map Tool
Extensive range of options for reporting fences and maps, including smart features such as dynamically defined scale bars and map data marker legends.Learn more -

Monitoring Tool
Stores, calculates and reports monitoring installation and results for Settlement Markers, Survey Prism, Rod Settlement Gauge, Standpipe Piezometer, Vibrating Wire Piezometer, Magnetic Extensometer and Inclinometer.Learn more -

Output Tool
Automated batch output of reports to print or pdf, and generate cross-sections along an alignment.Learn more -

Photo Tool
Link, organise and present a range of investigation related photos and images on gINT reports.Learn more -
Lab Tool
Geotechnical and construction materials Lab Information Management System (LIMS) within gINT supporting a range of classification and compaction related tests to ISO, BSI and ASTM.Learn more -

Security Tool Enterprise
Control access to SQL Server data, gINT applications and commands, tables and individual PointIDs or lab results, based on AD user name and AD groups.Learn more -

Processor Affinity Manager
Allows for multi-core processing when using gINT on a Terminal Server, or if you open multiple instances of gINT on your desktop.Learn more -

Advanced In Situ Tool
Stores, calculates and reports Advanced In Situ tests.Learn more
-
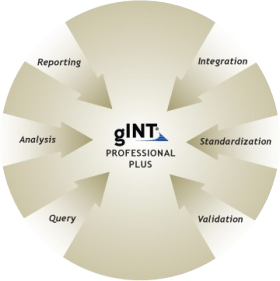
gINT Professional Plus
SQL Server based version of gINT with all the features of gINT Pro. A centralised data storage solution for companies with large quantities of data.Learn more -
gINT Professional
Cornerstone product, with nine report types including logs and sections/fences, and numerous import/export formats.Learn more -
gINT Logs
Database and entry level log production - borehole, test/trial pit, well, CPT, and DCP.Learn more